Dear potential user of the sunflower diagram drawing
software package!
Use of the package is permitted
exclusively for research purposes (articles and websites) and for your own
non-commercial and non-public use. (It is not allowed to be used on any other
public websites except on the websites of research projects).
If pictures of sunflowers and/or the
corresponding table - is made with the above-mentioned use, then the following
text must be indicated on a visible place for each product:
"The diagram and
the table are made with the package for drawing sunflowers, made by the company
MEIS d.o.o. (www.meis.si).
The diagram is
defined in a scientific article:
Božnar, Marija Zlata
& Grašič, Boštjan & Mlakar, Primož & Soares, Jacyra & de
Oliveira, Amauri Pereira & Costa, Tássio Santos, 2015. "Radial
frequency diagram (sunflower) for the analysis of diurnal cycle parameters:
Solar energy application," Applied Energy, Elsevier, vol. 154(C), pages
592-602. https://doi.org/10.1016/j.apenergy.2015.05.055 "
For details or for commercial use,
contact MEIS d.o.o. to the email address: info@meis.si.
I agree to the above terms of
use and I want to download the package.
The SUNFLOWER diagram is intended for
the graphical presentation of statistics of data with a 24-hour
cycle. The statistics can be produced for arbitrarily long periods
from a few days to a few years, and are represented by a pattern on a single
circular chart that has spikes for each of the 24 hours. On each spike, the
composition of the data for that hour in the entire period covered by the
statistics is presented.
We can draw several sunflowers for several periods and compare the
graphic patterns with each other.
Below is a simple sunflower example for two days of measurements.
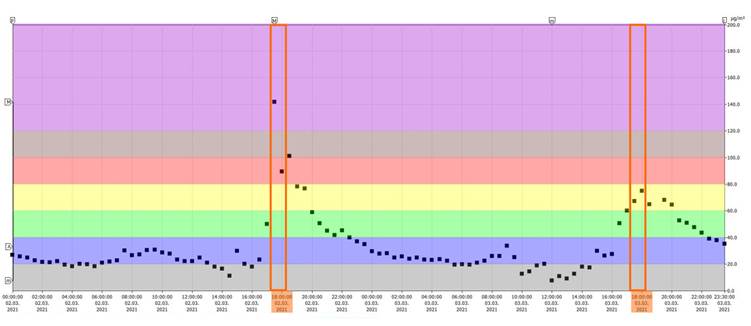
At 18:00 there are four data in two days (first day - 17:30 and 18:00,
second day the same).
On the time graph, these four values are
marked, and on the sunflower, these values are shown
in colours for the value classes belonging to 18:00 and as percentages for the
amount of data (2+1+1) in relation to the amount of all data. Percentages are
shown by arm (spike) length. (vsi==all, dobri==good, neznani==unknown,
prah==dust)
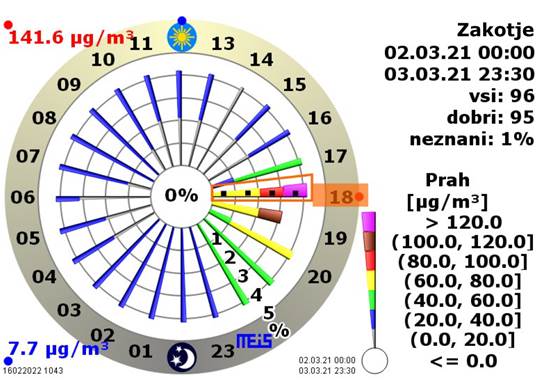
A comparison between the time graph and the sunflower for two days or 96
half-hourly intervals / values is shown. In
this case, one percent on the sunflower means approximately one dust value for
one half-hour interval.
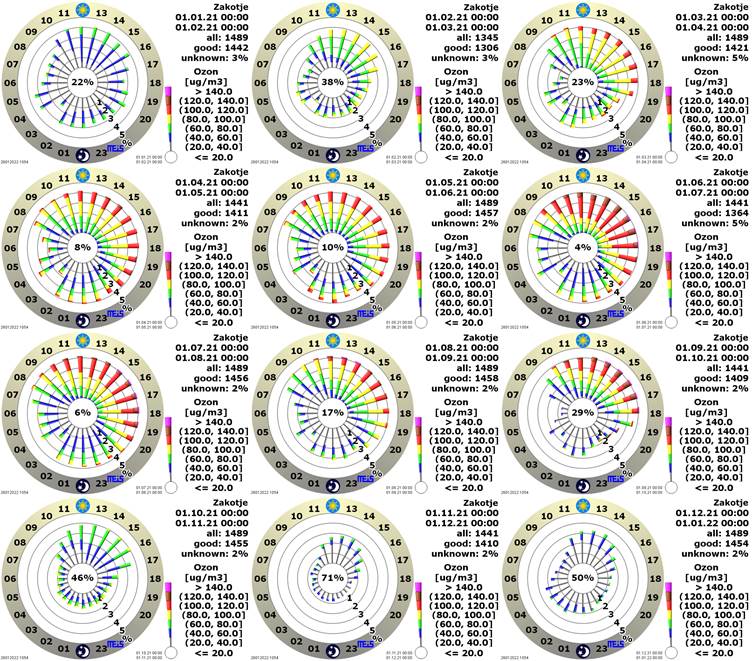
To conclude, below you can
also see ozone concentration sunflower diagrams for each month of the year for
the location "Zakotje".